If you’re a large electricity consumer in Ontario, you know that managing your Global Adjustment (GA) costs depends heavily on predicting system peaks. In the past, identifying the top five peaks through the IESO’s data was already challenging. Now, with the rise of batteries, demand response, and curtailment strategies flattening and stretching those peaks, the task has become even more complex. On top of that, we’re seeing rapid swings in demand with hundreds of megawatts appearing and disappearing within minutes.
So, what’s causing these massive fluctuations, and how will they shape the way we forecast Global Adjustment peaks under the Industrial Conservation Initiative (ICI)? Let’s unpack what’s happening.
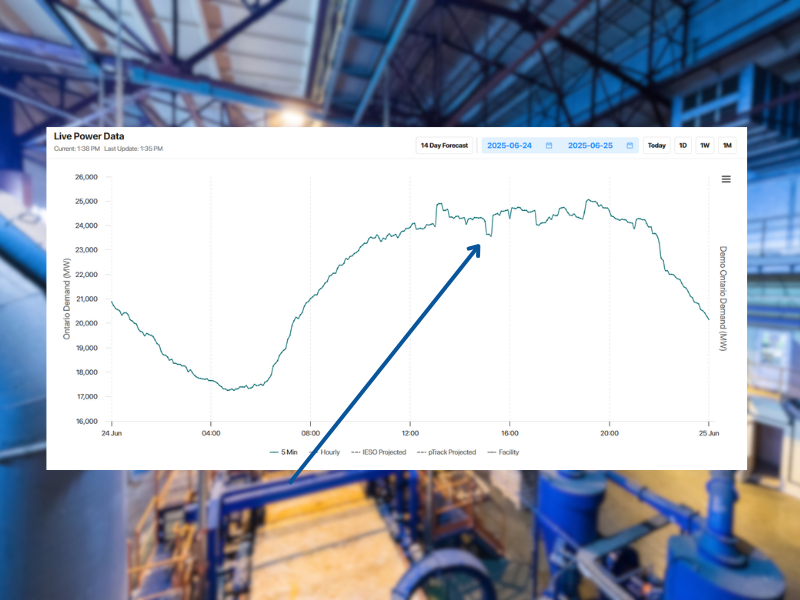
The Day Demand Jumped 800 MW in Five Minutes
On June 24, 2025, Ontario’s grid saw demand shoot up by more than 800 MW in just five minutes. These sudden changes weren’t caused by factories ramping up or solar panels suddenly switching off. Instead, they came from how the Independent Electricity System Operator (IESO) manages reliability, specifically, a tool called “blocking dispatches.”
This approach helps stabilize the grid when balancing energy across regions, but it also has a big side effect: it can make the province’s reported demand appear far more volatile than what customers are actually using.
How Ontario’s Five-Minute Demand Is Calculated
Ontario’s five-minute demand metric includes much more than what people and businesses consume. The IESO’s formula accounts for generation, exports, imports, losses, and other off-market activities:
Ontario Demand = Total Energy + Total Generation Without Offers – Total Exports + Total Off-Market ± Over/Under Generation
Here’s what those terms mean in simpler terms:
- Total Energy: All the energy dispatched to the grid, including imports.
- Total Generation Without Offers: Power from generators that didn’t submit market offers but are still supplying electricity.
- Total Exports: Power flowing out of Ontario to neighboring regions.
- Total Off-Market: Energy transactions outside the regular market structure, like emergency imports or reserve activations.
- Over/Under Generation: The small mismatch between what was planned and what was actually produced.
Because the IESO’s demand number includes these elements, changes in intertie flows, losses, or other adjustments can make it look like demand is spiking or dropping sharply. When dispatches are blocked to stabilize the system, these effects become even more pronounced.
What “Blocked Dispatches” Actually Mean
A “blocked dispatch” happens when the system operator temporarily holds certain generators at their current output, even if the normal dispatch algorithm suggests otherwise. It’s a way to manage transmission or reliability limits, often referred to as “bottling.”
Bottling means that generation exists, but it can’t reach where it’s needed because of limits in the transmission system. In other words, power is available at the source, but the lines can’t carry it to demand centers.
Blocked dispatches can result from:
- Transmission congestion or circuit limits
- Security or system reliability requirements
- Planned or unplanned outages
- Operational restrictions on specific facilities
- Insufficient transmission capacity in high-growth regions
In short, even when plenty of power is available, physical or operational limits can prevent it from being delivered, forcing the IESO to intervene.
The Post-Market Renewal Picture
Since Ontario’s Market Renewal Program (MRP) launched in May 2025, the number of blocked dispatches has climbed dramatically.
- In April 2025, there were 3,469 blocked dispatches.
- In May, that number more than doubled to 7,042.
- By July, it had reached 14,449.
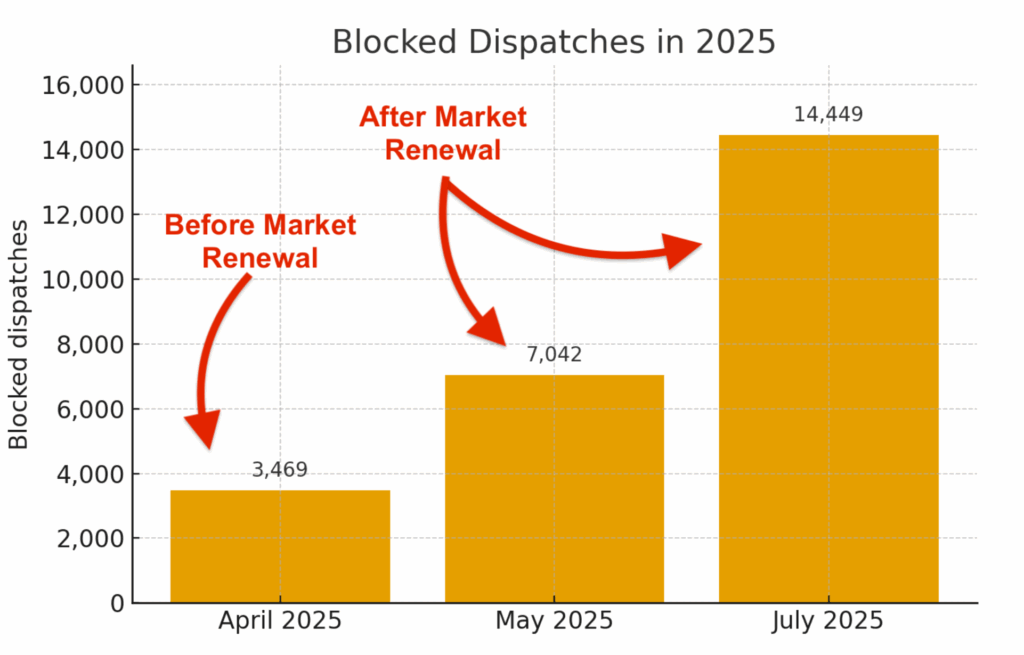
This rise coincided with greater volatility in real-time demand and pricing. As the new market design tightened its rules and reporting systems, operators leaned more heavily on blocking to manage imbalances, especially during high-demand periods.
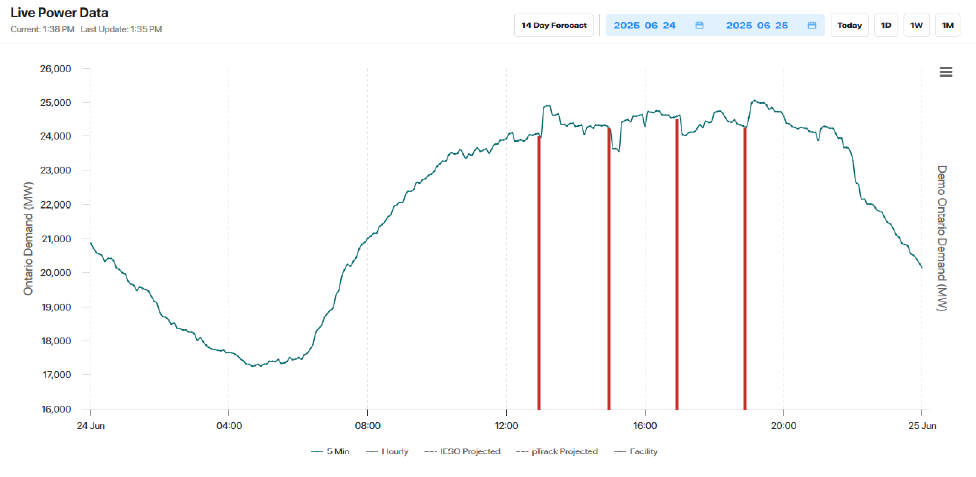
Why Blocked Dispatches Make Demand Look Volatile
Here’s a simplified way to understand it:
- ACE Deviation Appears: The grid’s “Area Control Error” (ACE) measures the difference between actual and scheduled power flows.
- The IESO Blocks Dispatches: To bring ACE back in line, it holds certain generators steady instead of letting them follow normal dispatch signals.
- Balancing Shifts Elsewhere: Other generators and intertie flows (imports and exports) pick up the slack, which can cause big visible changes in the reported demand.
Data Oscillations: Because blocked dispatches are only reported afterward, the system can overcorrect in later intervals, producing the jagged, sawtooth-like patterns often seen in demand charts.
Why It’s Happening More Often
Under the new market structure, Ontario’s dispatch and settlement systems are more tightly integrated. This means any constraint or imbalance can trigger more frequent operator interventions. Combined with the province’s heavy reliance on intertie flows, especially in the northwest, Ontario’s demand readings have become much more sensitive to these balancing actions.
What Market Participants Should Watch
If you’re tracking peaks or analyzing demand, there are a few indicators that can help you spot when blocked dispatches are affecting the data:
- Dispatch Scheduling Errors (DSE): These highlight when actual generation deviates from the schedule, often during times of ACE correction.
- Monthly Market Reports: These show when real demand diverges from forecasts, which often lines up with operator interventions.
Monitoring these signals can help analysts understand when the IESO’s balancing actions, not consumer behavior, are driving changes in demand.
The Bottom Line
Blocked dispatches are essential for keeping Ontario’s grid reliable, but they also make demand data look more volatile than it really is. The sharp 5-minute jumps, like the one on June 24, are less about real consumption and more about how the grid manages itself in real time.
For those managing Global Adjustment costs, this means traditional forecasting models may no longer capture the full picture. As the market evolves, accounting for operational behaviors like blocked dispatches will be key to avoiding missed peaks and unexpected costs.
Edgecom Energy enables industrial customers to know when peaks will occur and how to avoid extra charges on their energy bills. Contact us today to learn more.